Creating a Profile to Enable the Advanced Logging Levels
Best Practices
-
Create a separate profile for enabling IAFI debug logging when troubleshooting.
-
Do not leave debug logging enabled for an extended period of time.
-
Remove the debug profile when troubleshooting is no longer required.
-
If you need additional OS level log files, refer to this KB article: Debugging / How to Collect and Send Device Log Files to IGEL Support
-
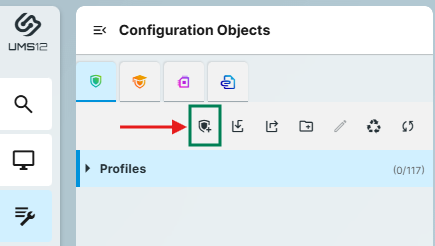
Open the UMS Web App and select Configuration Objects on the main menu or left side menu.
-
Click the icon to Create new profile.
-
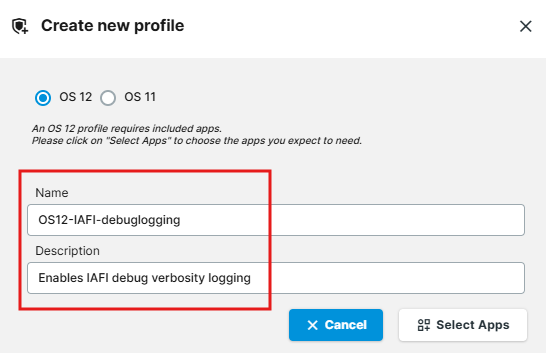
Give the OS 12 profile a name and easy description like the example shown here.
-
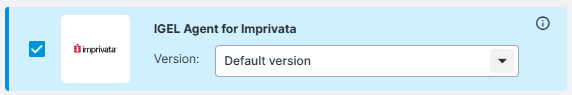
Click the Select Apps button and in the App Selector, pick the IGEL Agent for Imprivata as the app and click Save.
NOTE: In the app selector, if you have Show Versions enabled, you can leave it at Default Version or select a specific IAFI app version installed on the endpoint.
-
In the Profile Configurator, go to Apps > IGEL Agent for Imprivata.
-
Scroll down to the Logging Verbosity option and modify the settings to switch to debug or error log levels:
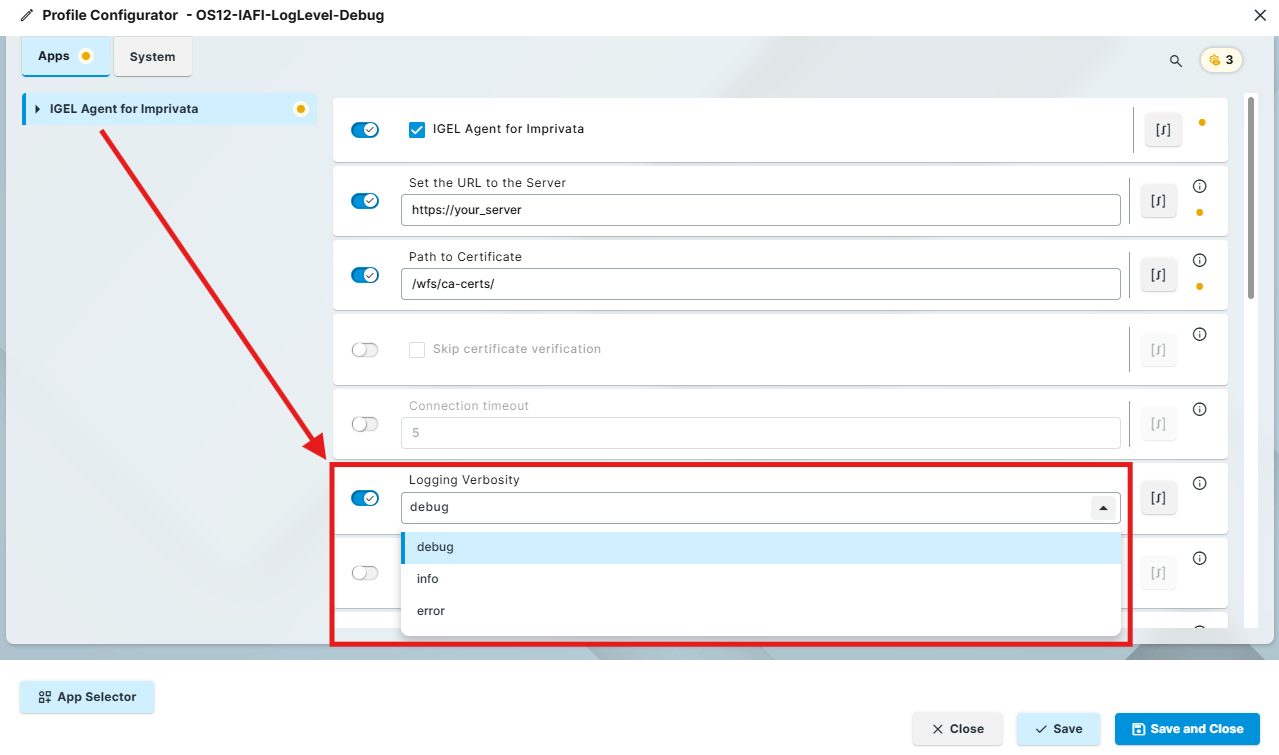
IMPORTANT: Do not leave debug or error logging on continuously. It should only be enabled for troubleshooting and removed when completed. Switch back to info logging for normal production use.
-
Save the profile and apply it to the device/folder as needed.
|
Log location |
|
|
|
Log Files |
Main agent/appliance activity log |
|
|
RFIdeas reader log. Will show activity with the prox reader |
|
|
|
Only seen if an agent crash occurs |
|
Live Monitoring the Log Files While Troubleshooting
This requires the log level to be in debug mode.
Tailing the Log Files
-
Create a profile for a local terminal or use a remote terminal session.
-
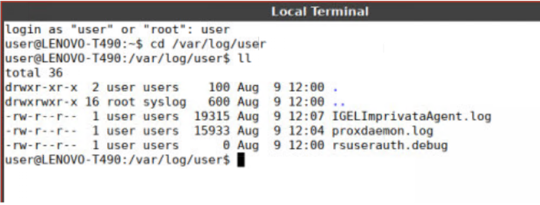
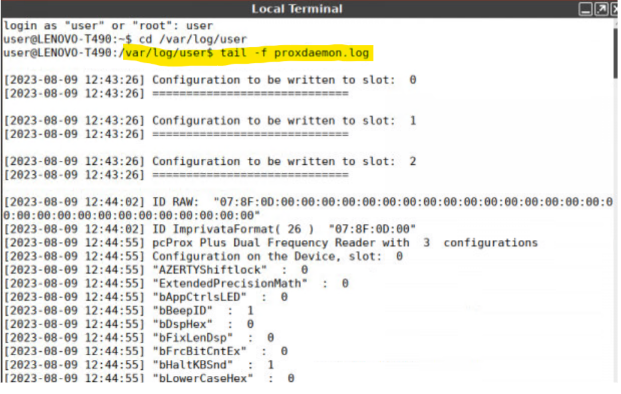
Open the terminal session and change to the user context.
-
If logged in as root, type
su userto change to the user context.
-
At the command line, type
/var/log/userand hit [Enter].
-
Type
lsto see the contents of the directory.
You should see theIGELImprivataAgent.logfile.
-
Type
tail -f IGELImprivataAgent.logand hit [Enter].
You should see live activity in the log file as you authenticate or use the agent system tray icon menu options like Sync.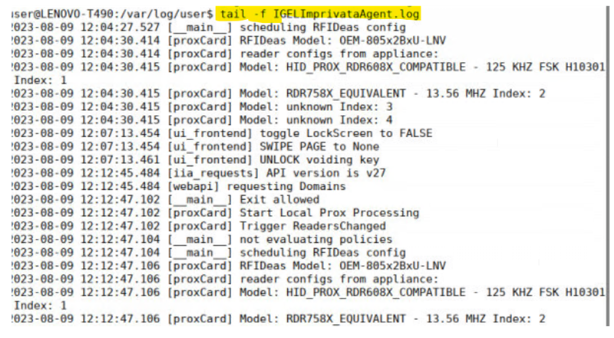
-
Optional: To monitor the RFIdeas proximity card daemon, type
tail -f proxdaemon.logand hit [Enter].
You should see information about the configuration assigned to the proximity reader from the Imprivata Computer Policy – General Tab – Card Readers section.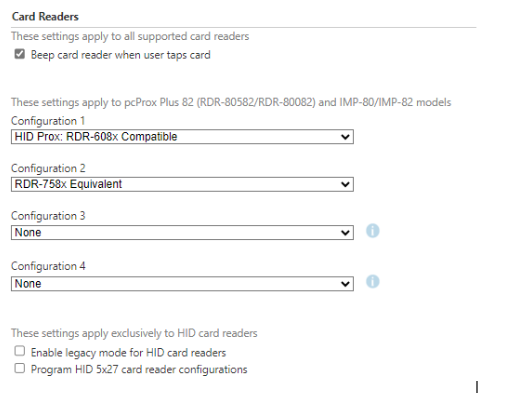
Saving the Log Files for Support
|
Option 1 |
From the UMS, use the “Save device files for support” feature |
|
Option 2 |
From a terminal, run this command:
This will create a zip file in |
Opening a Support Case
→ Log into the IGEL Customer Service Support Portal to open a case and provide the following data:
-
IGEL OS version
-
VDI Session Type (ex: AVD, Citrix, VMWare, etc.)
-
Name the case: IGEL Agent for Imprivata – issue description
-
Attach the log files to the case along with any pictures or videos of the issue.
How to Enable Debugging for VDI Session Types
It may be helpful to enable additional debug logging for the different IGEL OS apps when you need to open a support case. Follow these best practices to enable logging for these apps.
General Information
-
Please also activate the debug logging of the base system in case of problems with apps.
-
All parameters of apps are found in the registry under app.[appname] e.g., app.cwa. This also applies to the session parameters.
-
The start scripts of apps are no longer located under
/config/sessions, but under/config/sessions/[appname]. -
The setup sites of all apps can be found under Apps.
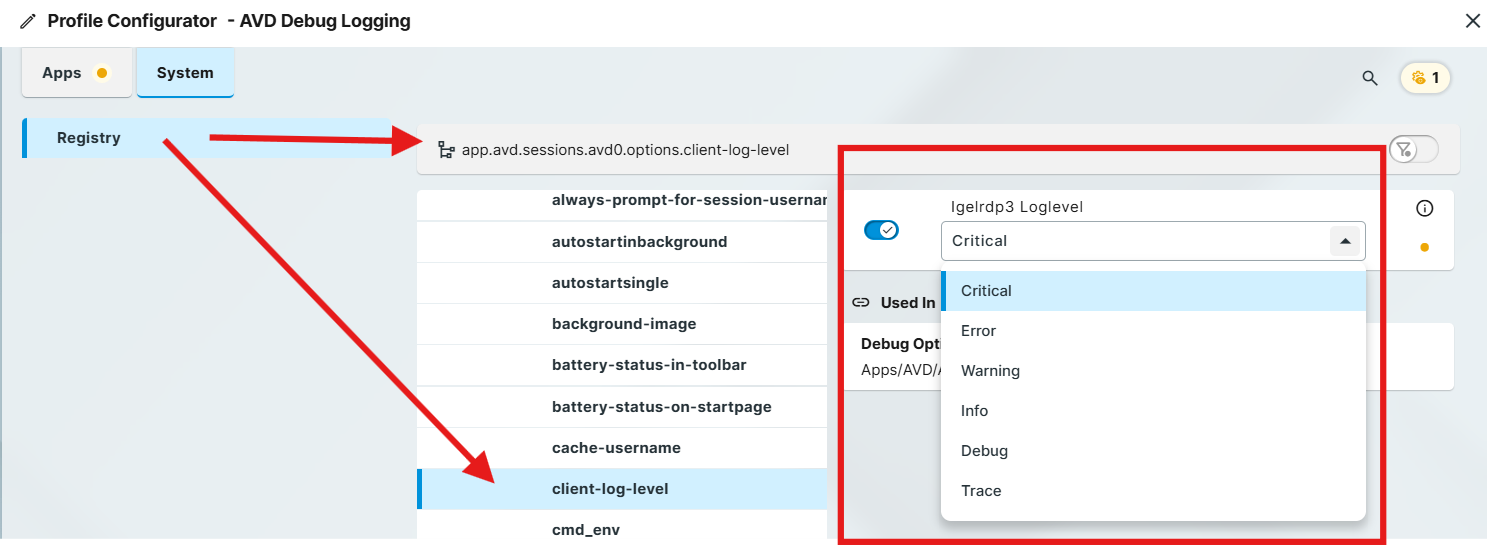
Microsoft AVD
-
OS 12 registry parameter:
-
app.avd.sessions.avd<x>.options.client-log-level (Critical, Error, Warning, Info, Debug, Trace)
-
Template Profile
Download this profile and import into UMS as an example: AVD-debuglogging.ipm
-
Logfiles:
-
/var/log/user
-
-
Collected with WUMS: yes
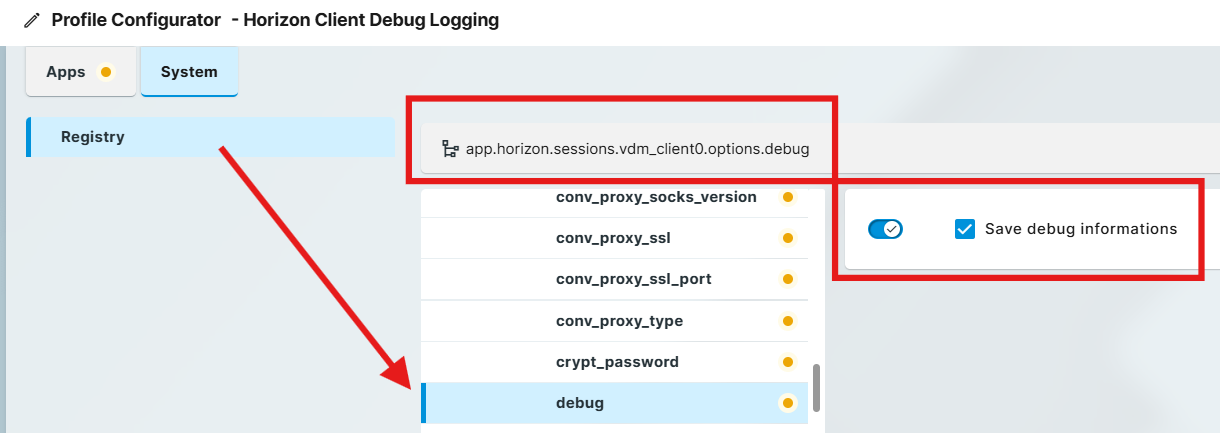
Omnissa Horizon Client
Dependencies: None
Template Profile
Download and import this profile into the UMS for an example: HorizonClient-debuglogging.ipm
-
Parameter:
-
app.horizon.vdm_client<x>.options.debug
-
-
Logfiles:
-
/var/log/vmviewsess<x>.debug
-
-
Collected with WUMS: yes
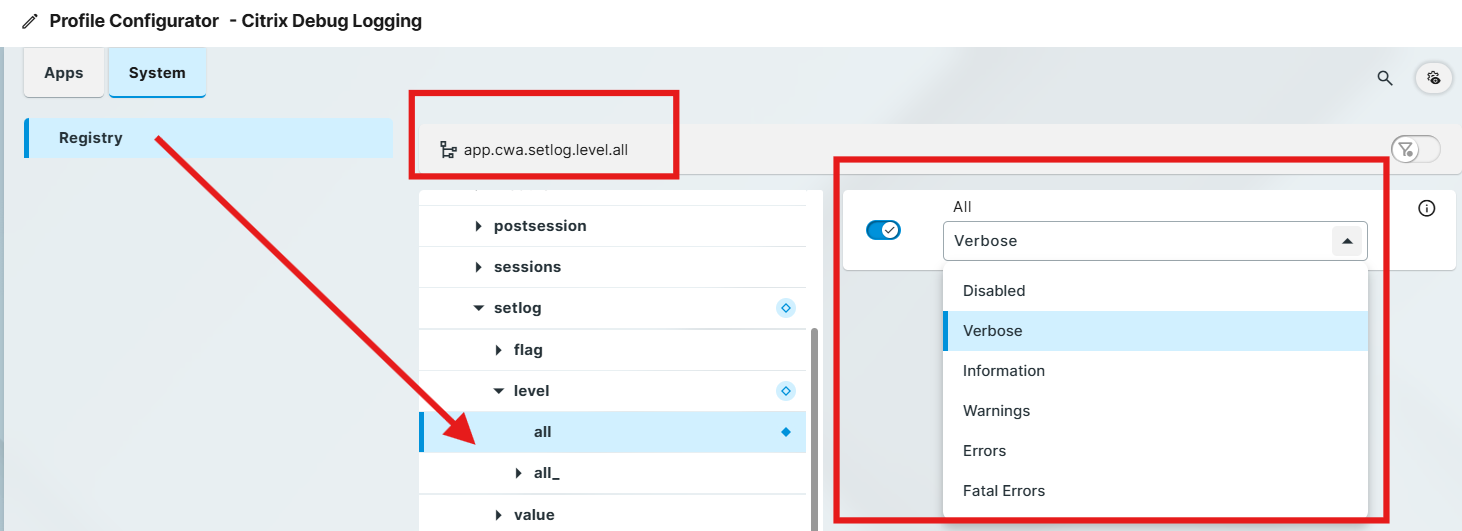
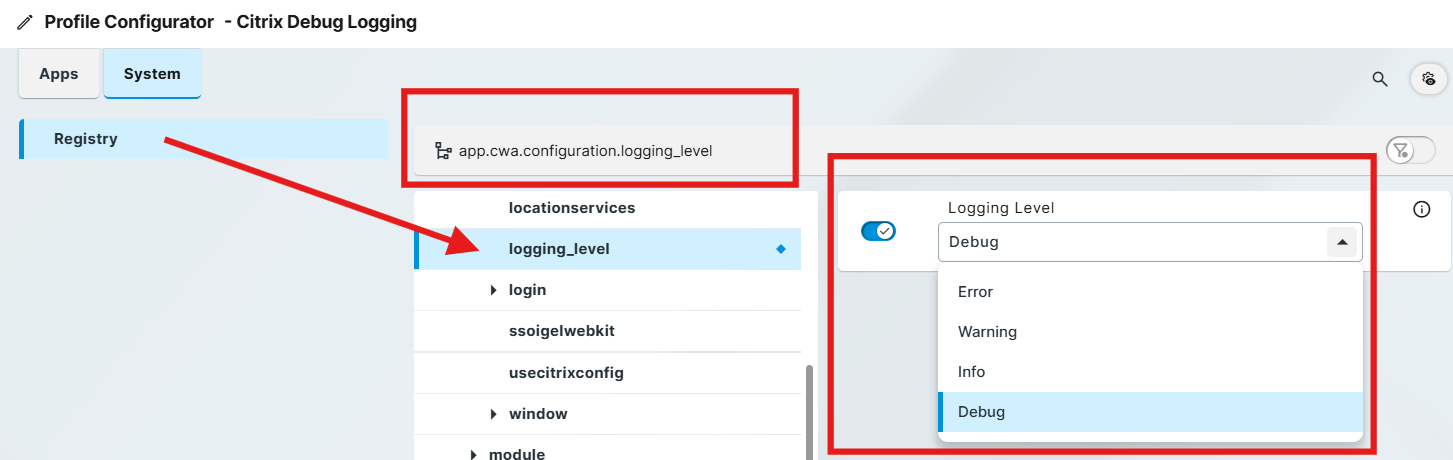
Citrix Workspace App
Template Profile
Download this profile and import it into the UMS as an example: CitrixWSA-debuglogging.ipm
Parameter: app.cwa.configuration.logging_level (Error, Warning, Info, Debug)
Parameter: app.cwa.setlog.level.all (Disabled, Verbose, Information, Warnings, Errors, Fatal Errors)