Load Balancer - View Your IGEL UMS Load Balancer Information
In the Load Balancer node of the IGEL Universal Management Suite (UMS) Console, you can find basic information on all load balancers that belong to your UMS installation. For an individual load balancer, additional details such as process information, service status, statistical data, etc. are available.
Menu path: UMS Administration > UMS Network > Load Balancer
"Load Balancer" Node in the IGEL UMS
The Load Balancer node is visible in the UMS structure tree and active only if you have installed a UMS High Availability network with UMS Load Balancer activated. See IGEL UMS High Availability (HA).
The Load Balancer node lists all load balancers belonging to the UMS installation:

Normal Mode means that the load balancer is running with the normal "run configuration". Note that it does not serve as an indicator of the overall proper functioning of load balancers. If you want to check your HA environment, see UMS HA Health Check - Analyse Your IGEL UMS High Availability and Distributed UMS Systems.
Individual Load Balancer

Status Displays for the UMS Load Balancer
The status of the load balancers is shown by the following icons:
 | The load balancer is online. |
 | The load balancer is offline. |
 | The load balancer status is unknown (e.g. when a new load balancer is being propagated in the network). |
Process Configuration for the UMS Load Balancer
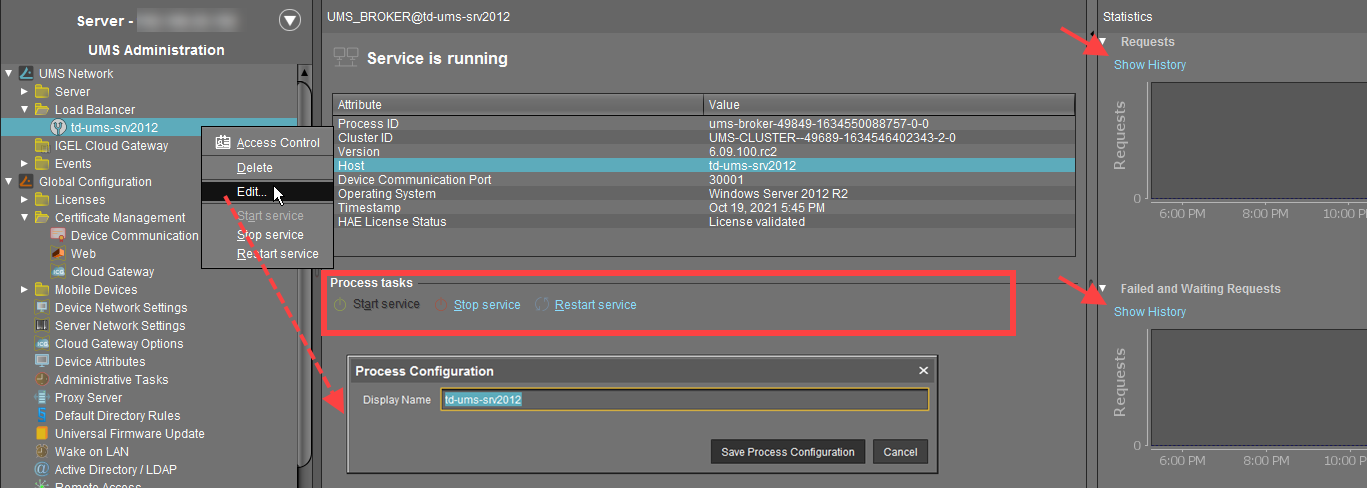
For each load balancer, you can edit the process configuration, e.g. you can change the Display Name for the load balancer.
→ To edit the process configuration, click Edit in the context menu of the required load balancer.
Process Tasks for the UMS Load Balancer
Under Process tasks, you can also start, stop, or restart the IGEL UMS Load Balancer service. For how you can start or stop services, see also IGEL UMS HA Services and Processes.
Statistics for the UMS Load Balancer
An overview of Requests and Failed and Waiting Requests by devices makes it possible to estimate the server load across the relevant time period.
→ Click on Show History to bring up a scalable view. You can use the mouse to zoom in on sections or restore the view by pressing the mouse button and moving the mouse to the left.
